
Uncategorized
now browsing by category
Bull flag formation for EUR/USD.
After the rate cut in deposit by ECB euro is trying to gain demand, but for how long ?
As of now the whole world is focusing on crude oil , statement such as “let the market find its own equilibrium” inflamed the bloodbath. Where would oil prices go from here? rumors are it will reach 20$ but there is a saying in the market “SELL THE RUMORS BUY THE FACTS” let us see where the market takes the turn.
On 4hr chart EUR/USD has formed a bull flag formation.
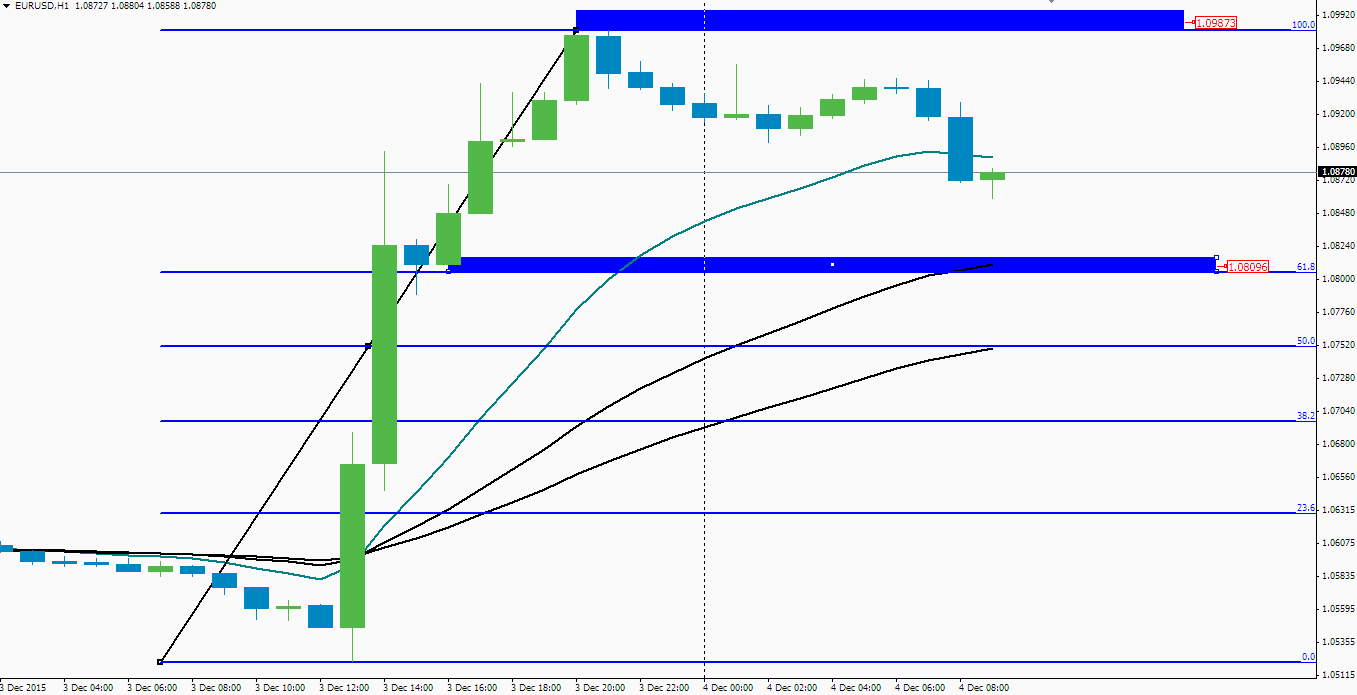
look for the fib rec of 38.20% (1.0840) which also support the fact that it is the correction of the impulse, this should continue the buying in EUR/USD further.
A break above 1.0975 would take EUR/USD to 1.100 levels and above with resistance coming at 1.1470.
Down side is following levels as of fib retc 38.20% ( 1.0808) followed by 50% retc 1.0750 and 61.8% retc 1.0695.
a break below 1.0695 would initiate sell once again.
though the market is anticipating the US rate hike it is yet to happen.
EUR/USD might consolidate in the rage of 1.0808 to 1.0970 for some time.
OPEC….oil market to effectively find its own equilibrium..
Crude oil faced significant falls as OPEC announced that the cartel is to abandon production target setting and will instead allow the oil market to effectively find its own equilibrium. Subsequently, crude oil prices fell over 6%, signalling that a return to the price slump of the late 90’s could be just around the corner.
The 1990’s were a tumultuous period for oil as OPEC sought to control global oil supply with an iron fist. However, the latter part of the decade saw the cartel effectively lose control of the market, and prices plunged to around $10.00 a barrel of crude. As any good historian will tell you, history often repeats and there are some striking similarities between the current market forces and those present in the 1990’s.
That decade in oil history saw exponentially increasing production from Venezuela flooding the world and upsetting the supply side of the market. In response, one of OPEC’s largest members, Saudi Arabia, lifted their production to effectively protect their market share in light of the South American upstarts in-roads to their racket.
The increased supply subsequently depressed world crude prices and the latter part of the decade became a wilderness for oil producers as OPEC’s grip over the market was effectively neutralised. However, like all downturns, price support was eventually discovered, and with the oil cartel’s stewardship, crude prices surged until reaching a peak of $150 a barrel by 2008.
Subsequently, it’s easy to draw a parallel between the current state of the market and that of the late 90’s. This is especially evident when you consider the role of US shale oil producers and, in extension OPEC, in the battle for market share. In fact, the cartel’s strategy of attempting to force out high cost producers smacks of their battle with Venezuela in the 1990’s.
Ultimately, it was political change in Venezuela that ushered in a reduction in oil supply, as the Hugo Chavez led Socialist government took action to cut production. Up until that point, markets remained awash in a crude excess that was difficult to clear. Within a relatively short period of time oil prices rebounded and OPEC had largely regained control of the market.
Currently, it would appear that the political component will largely be the deciding determinant in the ongoing supply war. The question remains as to which regime will blink first in the battle over OPEC’s hegemony over crude oil.
However, this time the Middle Eastern nations have their respective backs to the wall as dwindling foreign currency reserves, and export revenues, put their national accounts under pressure. Given their lack of GDP diversity, and strong reliance upon crude oil export revenues, it’s almost certain that cracks will start to appear amongst the OPEC member states. In contrast, the US economy retains a much greater GDP diversity that is likely to allow them to whether the storm, whilst shale producers continue to produce domestically.
Subsequently, the question remains as to which regimes have the political will to continue the battle in the face of mounting domestic funding pressures. In my humble opinion, OPEC producers will need to blink first, and surrender significant market share, to allow the market, and their respective trade revenues, to rebalance. Otherwise a continuation of the cartel’s strategy of over-supply will continue to damage the global crude market and we could very well see oil prices back in the $20.00’s
market outlook.
After yesterday’s massive ECB-induced moves across all markets, traders were a bit shell-shocked heading into the always important Non-Farm Payrolls report. Today’s jobs report was even more highly anticipated than usual because it represented the last major US economic release ahead of the Fed’s December monetary policy meeting, where the central bank is mulling its first interest rate hike in nearly a decade.
The US economy created 211k jobs in the month of November, slightly better than the 201k anticipated. Furthermore, revisions added 35k jobs to the previous two months’ reports.
Prior to Thursday’s ECB announcement, EUR/USD had dropped steadily to approach its downside target of 1.0500. After the ECB, the currency pair rose rapidly above 1.0800 resistance to hit its 50-day moving average. On Friday, immediately after the NFP results, EUR/USD fluctuated around this 50-day moving average but generally remained strong, maintaining Thursday’s gains. Despite the spike for EUR/USD, a divergence in monetary policy continues to exist between the ECB and Fed. The spike occurred primarily because the market was surprised by the rather tepid actions of the ECB. Therefore, as long as some form of this divergence remains in play, EUR/USD should continue to be pressured over the longer term. On any further short-term rebound, major resistance resides directly above, around the 200-day moving average and the key 1.1100 resistance level. To the downside, any sustained return below 1.0800 should see a resumption of the bearish bias for EUR/USD, with the key downside target remaining at the noted 1.0500 support level. Longer-term, further downside targets reside at 1.0200 and parity (1.0000).
It’s A Bird… It’s A Plane…NO It’s EURO…
At the meeting of the Governing Council of the ECB decided that the interest rate on the main refinancing operations and the interest rates on the marginal lending facility and the deposit facility will remain unchanged at 0.05%, 0.30% and -0.20% respectively.
This created quite a steer in the market as EUR/USD JUMPED TO 1.0980 from the days low of 1.0522.
GBP/USD also joined the rally running to the upside and plotting a high at 1.5159.
Could this be the possible come back for euro or is it just another selling opportunity .. well all the answer would be given once the most anticipated interest rate hike would be delivered by US.
As of today all eyes will eager to see the NFP figures.
Technical levels for today
EUR/USD
Upside : 1.0940 and 1.0980 a break above this level could check the psychological level of 1.1000.
Down side: 1.0860 and 1.0820
GBP/USD
Up side: 1.5122 , 1.5155 and 1.5195.
Down side: 1.5080 , 1.5055 and 1.5025.
Calm before the storm.
The calm before the ECB storm’ appeared to emerge the main theme in Asia, with the majors trading within limited range in anticipation of huge volatility stirred by the ECB decision. While dust settled over Yellen’s comments overnight and traders once gear up for more Yellen in the day ahead. On the FX front, the sentiment around the greenback remained lifted amid optimistic remarks from Yellen and solid US ADP jobs data. The Fed Chair Yellen commented on Wednesday that the US economic outlook has improved than previously seen and that the Fed remains on track for a rate lift-off this month with the focus now on Friday’s NFP report, the last one before FOMC decision on Dec 16.
Yesterday GBP/USD went to the pits testing 1.4895 levels. while EUR/USD staying in the range 1.0632 and 1.0550.
The big new today would be EUR :Minimum Bid Rate and ECB Press Conference.
US: Unemployment Claims, Fed Chair Yellen Testifies and ISM Non-Manufacturing PMI.
TECHNICAL LEVELS FOR TODAY
EUR/USD
upside : First resistance at 1.0632, followed by 1.0667 and 1.0720
down side: First support at 1.0550 , followed by 1.0510 and 1.0470 a break below this level would trigger the free fall.
GBP/USD
Upside : First resistance at 1.4956 followed by 1.488 and 1.5015.
Down side: 1.4895 , 1.4854 a break below this level would test 1.4010 level.
Market view 02/12/2015
As the market started off with Australian Gross Domestic Product (GDP) which was better than expect , there is less movement in the market as we have much too look out for today.
GBP: Construction PMI to
USD :ADP Non-Farm Employment Change
CAD: BOC Rate Statement and Overnight Rate
but most of the trader would be waiting for Federal reserve Chair Janet Yellen speech as they would attempt to decipher interest rate clues.
Technical levels to look out for
AUD/USD
Upside : 0.7345 and resistance on 0.7382 a break above this level would take the pair to .07407 and 0.7435.
Down side: first support is at 0.7272 followed by 0.7250 and 0.7220.
GBP/USD
Upside : resistance at 1.5125 and 1.5167 a break above this level would take cable to 1.5200
Down side : First support is at 1.5050 and 1.4998 a break below this level would take GBP/USD to 1.4655 and 1.4925.
EUR/USD
It is very difficult to take a stance for EUR/USD as there are every important feeds yet to come form ECB Press Conference and bid rate which would be released tomorrow that could surprise the market. Decision on QE is much awaited and not to forget rate hike by US Fed is also yet to come on 17th (12:30 GMT+5).
As of today it is likely that ADP Non-Farm Employment Change would be in the expected range of 191k to 200k.
EUR/USD
Upside :First resistance at 1.0640 followed 1.0668 and 1.0720.
Down side : First support at 1.0592 and 1.0562.
Whats with pound?
After breaking the 1.500 level GBP/USD registered a SIX MONTHS LOW of 1.4994. Cable not only recovered from the low but also managed to close above 1.5050 level.
1/12/2015 all eyes would be on BOE (bank stress test) , Manufacturing PMI and comments form BOE Governor Mark Carney.
Technical levels to look out for GBP/USD
At present GBU/USD is trading at 1.5080
Upside : 1.5125 which is the immediate resistance and a break above this level could lead to 1.5167
Downside : 1.5030 and previous day low of 1.4994 is like possible.
What to expect AUD/USD?
The latest upbeat Caixin Chinese manufacturing PMI report coupled with the risk-on rally in the equities provided a double booster shot to the Australian dollar, driving the AUD/USD through the roof towards the key 0.7286 levels (Nov 25 High). More so, the recovery in the commodity prices also supported the renewed bids in the Aussie.
KEY LEVELS TO WATCH OUT FOR.
The pair tested Nov 25 High at 0.7286 and now hovers near 0.7275 region, with the immediate resistance at 0.7299 (Oct 23 High), above which gains could be extended to strong hurdle located at 0.7365/66 (Oct 13 & 15 High) levels. On the flip side, should the RBA statement sound dovish or talk down on the AUD level, the price would drop to the immediate support is seen at 0.7220 (20-DMA). Selling pressure is likely to intensify below the last, dragging the Aussie to 0.7169 (100-DMA).
GBP/JPY TRADING RANGE 30/11/2015
GBP/JPY trading for …..
upside is 185.06 and 185.45
with the downside potential of
184.46 and 184.15 below that it would check 183.85
As per the monetary police speech is concerned visit the following link to read the full report in detail.
“Japan’s Economy and Monetary Policy” (Speech at a Meeting with Business Leaders in Nagoya) (30/11/2015)
XTIUSD what’s on Monday.
Earlier this week, Saudi Arabia sent indications that it could consider adjusting its price and production forecasts in an effort to stabilize global energy markets. Last November, OPEC rattled markets worldwide when it left its production ceiling above 30 million barrels per day. The position triggered an extended battle with U.S. shale producers for market share, flooding markets with a glut of oversupply. As a result, crude futures have slumped by more than 40% over the last year spending the majority of 2015 near lows not previously seen since the Financial Crisis.

upside correction of 43.60 and 44.75 where as a
down side of 40.80 and further low of 39.00 is likely .